Knowledge graphs are vital tools for organizing complex information in biology and medicine. Network analytics allows us to extract new insights from data that are represented as a knowledge graph. The goal of this article is to introduce you to powerful knowledge graph tools. I will also show you how to use these tools to predict disease similarity and compound similarity by using an unsupervised approach. For the real-world data investigated, we describe the method (code included!) to achieve high-accuracy predictive results.
Knowledge graphs: what are they?
Today’s data are more than rows and columns. Tables are great for representing data with regular and sequential relationships. However, knowledge graphs are the superior choice when representing data with interconnected, irregular, or implicit relationships.
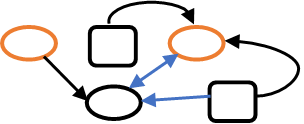
A knowledge graph consists of entities, relationships, and attributes. In Figure 1, entities belonging to two types are represented by squares and ovals. The relationships between the entities, which can be unidirectional or bidirectional, are represented by arrows. Attributes can describe either entities or relationships. In this example, they are indicated by color. This data construct is maximally flexible because entities can be connected to other entities through an arbitrary number of relationships. As well, both entities and relationships can possess an arbitrary number of attributes. Knowledge graphs enable all sorts of real-world applications including healthcare and medicine, internet search engines, detection of financial crime, marketing and intelligent recommendation, and many others.
For all the benefits knowledge graphs offer, they also come with challenges. They are often incomplete, rapidly changing, or populated by error-prone processes. Fortunately, there are analytical tools that, despite these challenges, help make the best inferences possible from knowledge graphs.
What do knowledge graphs look like?
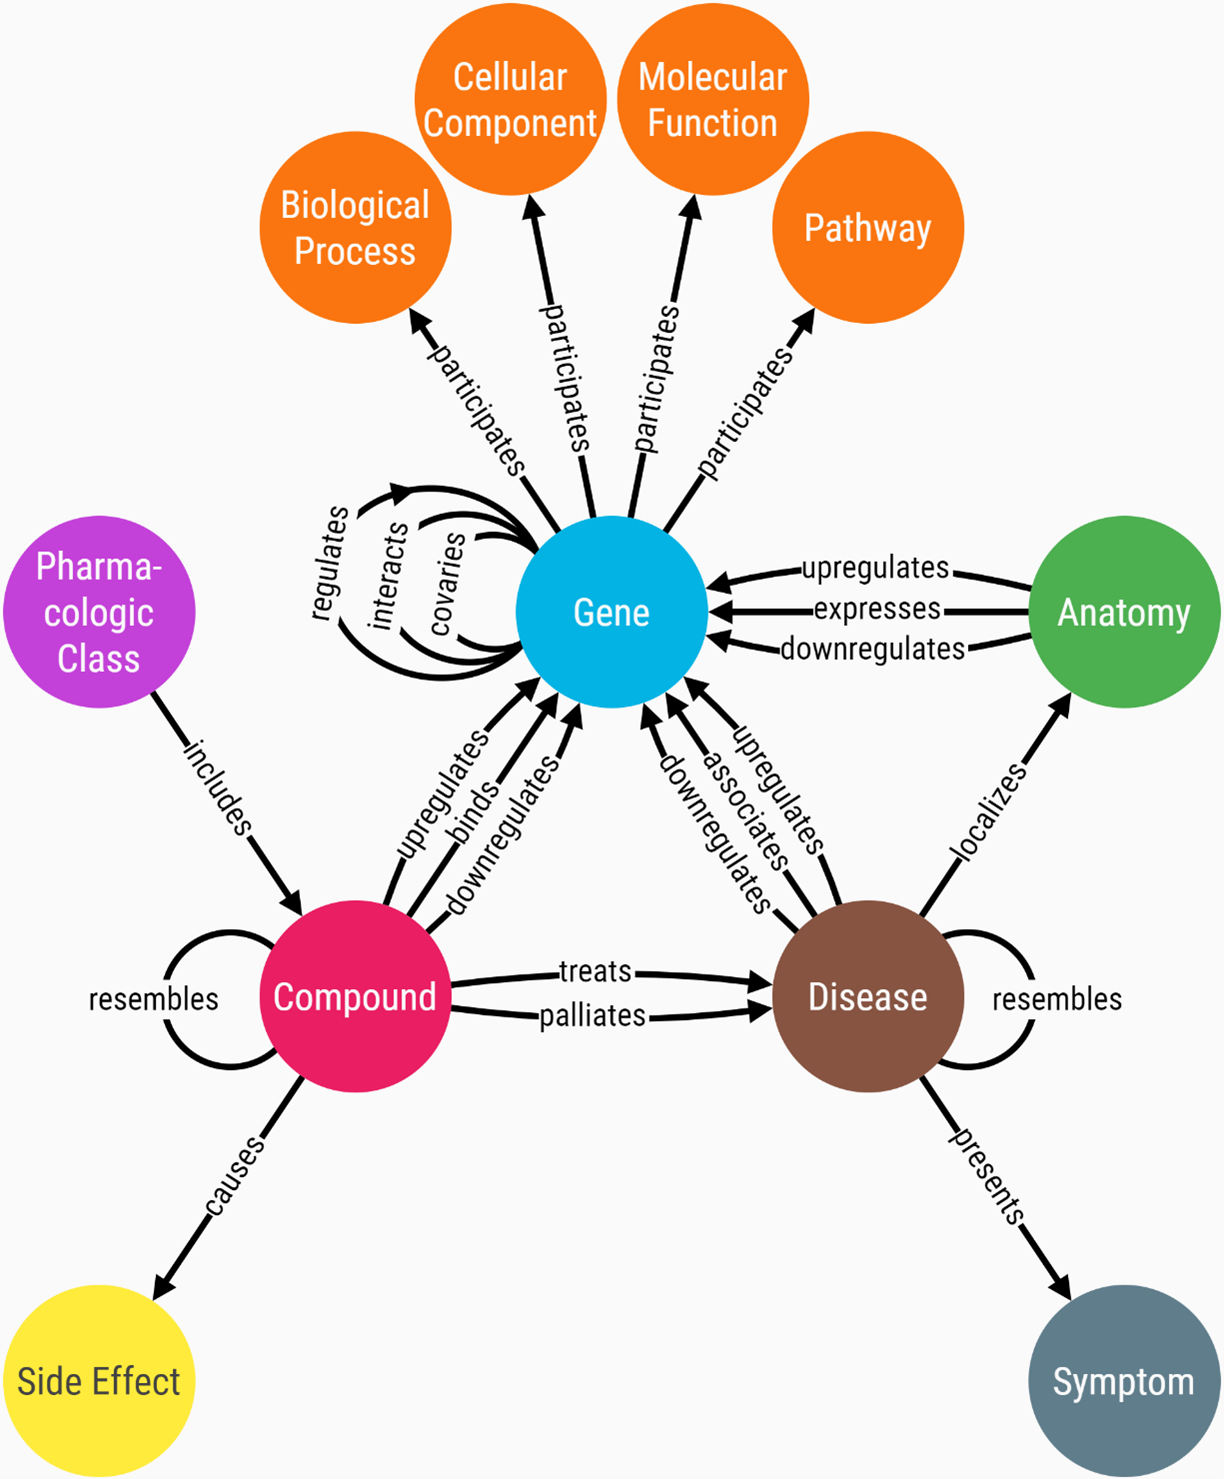
One example of a knowledge graph in the field of biomedicine is Hetionet. This graph encodes relationships mined from millions of published studies (2017 Systematic integration of biomedical knowledge prioritizes drugs for repurposing eLife 6:e26726). From the data model (or metagraph), you can get a sense of the types of entities and relationships that are present in the graph. The metagraph is displayed in Figure 2.
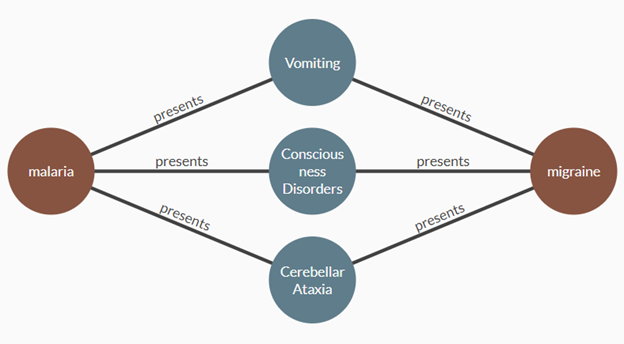
The entire knowledge graph contains tens of thousands of entities and more than one million relationships. But it is often instructive to view small subgraphs that focus on one or more entities of interest. The subgraph in Figure 3, for instance, displays all the symptoms that the diseases malaria and migraine have in common.
What is link prediction and why should I care?
Knowledge graph data are often incomplete – perhaps the data collection process is imperfect or the true connections in the data are difficult to observe. Link prediction is the task of filling in those missing connections. In Hetionet, link prediction is quite valuable. The links in the data set were constructed by a manual process, and the information represented in the knowledge graph is far from comprehensive. By performing link prediction on incomplete data, you can augment the knowledge graph by identifying potential links that were missed by the manual process.
How can I leverage SAS® Viya to perform link prediction on a knowledge graph?
There are easy-to-use tools in SAS Viya to help you perform link prediction on knowledge graph data. Referring again to the Hetionet knowledge graph data, consider the following two link prediction tasks:
- Remove all “Disease-resembles-Disease” links from the graph. Then, use the remaining graph to predict which pairs of Disease nodes should be linked.
- Remove all “Compound-resembles-Compound” links from the graph. Then use the remaining graph to predict which pairs of Compound nodes should be linked.
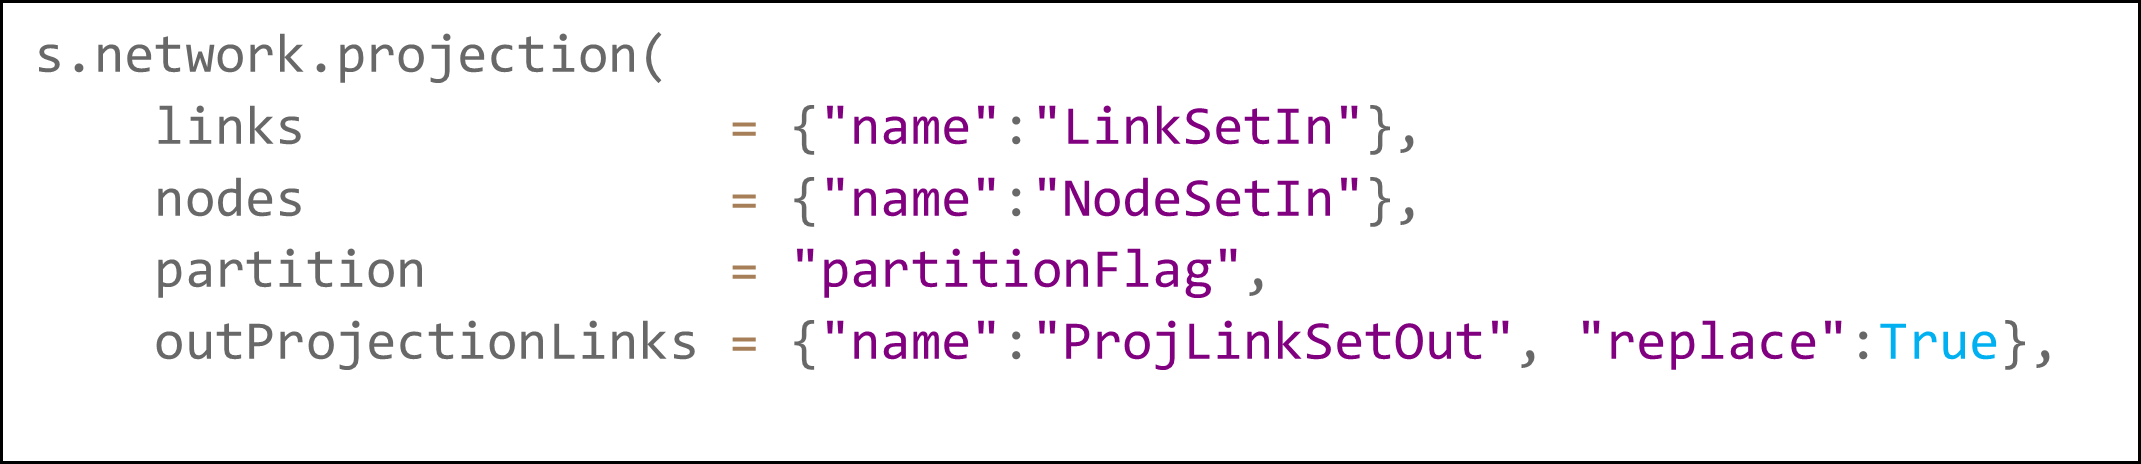
These are both unsupervised machine learning tasks because no ground truth examples of the links to be predicted will be available to the routine making the predictions. With SAS Viya, the procedure to make predictions is quite simple. The heart of the analysis is the projection action in the Network action set. The syntax for this action is demonstrated in the code snippet in Figure 4. For more details about network projection, see the online documentation for the NETWORK procedure and the projection action.
The full example notebook is available on GitHub. The steps are summarized here:
- Prepare the data by removing all the “resembles” links to be predicted.
- For each link type in the graph, run the projection action in the network action set. Network projection is one popular mechanism for inferring linked nodes in a knowledge graph. The output of Network projection is a set of inferred links with scores associated with the strength of their mutual relationships.
- Aggregate the link scores that you obtain from the projection runs across the various link types.
- Sort the potential links in descending order by the aggregated score. The potential links with the highest scores are those with the highest likelihood of being ground truth “resembles” links.
Results summary
You can use the same four-step process to accomplish two link prediction tasks. The first task is to predict Disease-resembles-Disease links (cells 10 through 23 in the linked example notebook). The second task is to Compound-resembles-Compound links (cells 24 through 30 in the linked example notebook). To summarize the efficacy of prediction tasks, you can count the number of correct predictions among the top k predictions from the model. This is known as the hits @ k metric.
The results obtained in the example notebook are tabulated in Table 1: Link prediction results.
| k | Task 1 Hits@ k (Disease-resembles-Disease) |
Task 2 Hits@ k (Compound-resembles-Compound) |
| 10 | 7 | 10 |
| 100 | 64 | 54 |
| 1000 | 303 | 249 |
This method of prediction achieves high accuracy on both unsupervised prediction tasks based on the Hetionet data set, especially in the top ten predictions.
There are multiple biomedical use cases for knowledge graph link prediction models. One such use case is human-assisted or automated labeling of newly added data. If links can be generated with high accuracy when new data arrive, then the curation time required by subject matter experts is reduced.
Another use case is drug repurposing. Link prediction models can be effective tools for identifying new uses for existing drugs. Drug repurposing is a critical tool in the fight against emerging infectious diseases.
Knowledge graph conclusion
In summary, this post has provided a brief introduction to knowledge graphs, outlined an analytical workflow for making predictions based on knowledge graph data, and presented results from a hands-on demonstration based on real-world data. For the complex task of unsupervised link prediction, the technique of network projection proved useful for identifying ground-truth connections that were intentionally hidden from the model. The analysis presented here is straightforward to implement, thanks to the projection action in the Network Action Set. To learn more about the power of SAS Viya, you can browse the other actions in the SAS Visual Data Mining and Machine Learning programming guide.